Proxy Season 2014: A Mid-Year Look at What’s Hot and What’s Not
July 14, 2014
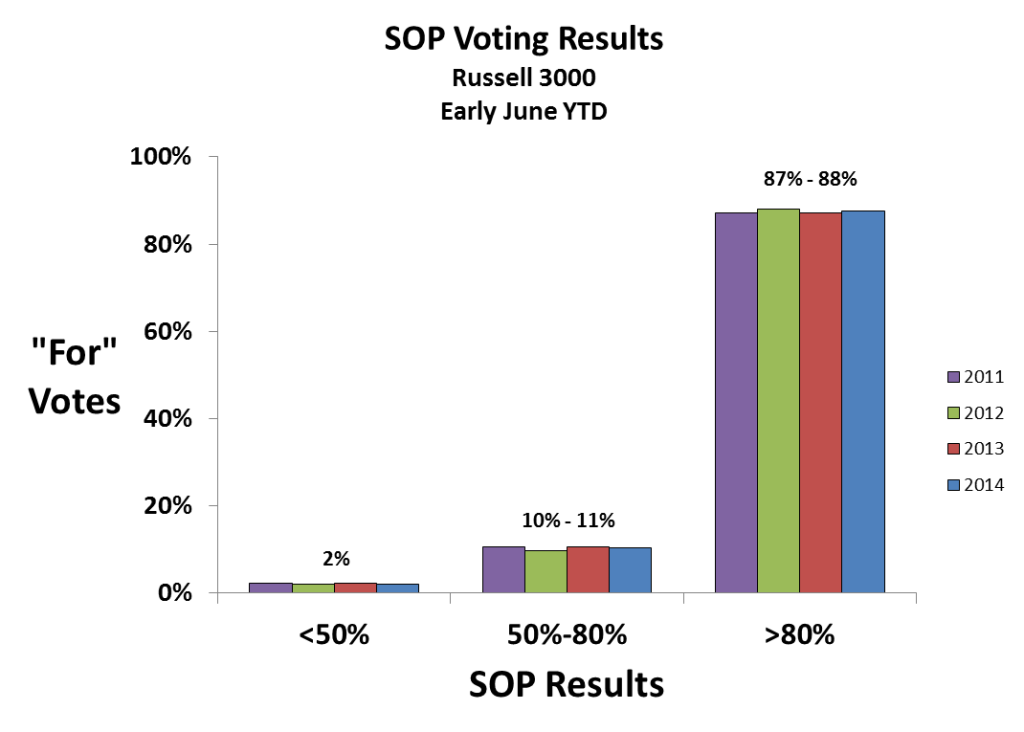
We are currently midway through the year and beyond the 2014 proxy surge. In the fourth year of Say on Pay (SOP), we are wondering if this year is different from past years. So far in 2014, nearly 2,000 of the Russell 3000 companies have reported their SOP results. As shown in the chart below, there has been remarkably little difference in the year-to-date SOP voting results. Eighty-eight percent of companies received a >80% “For” vote, 10% received a 50-80% “For” vote, and 2% received a <50% “For” vote. The one caveat is that strong support one year does not guarantee support in subsequent years. However, companies that fail their SOP one year seem to find religion by correcting their pay practices to pass their votes the following year.

While SOP support has been running at a fairly constant level, there are other trends in CEO pay practices among the Russell 3000 that signify change. These include:
- Increasing target CEO pay
- Increasing Performance-Adjusted Compensation (PACTM)
- Higher mix of performance-based pay, in particular, performance shares
- Widening gap between CEO and Named Executive Officer pay
- Shareholder engagement becoming mainstream
Trend #1: Increasing target CEO pay
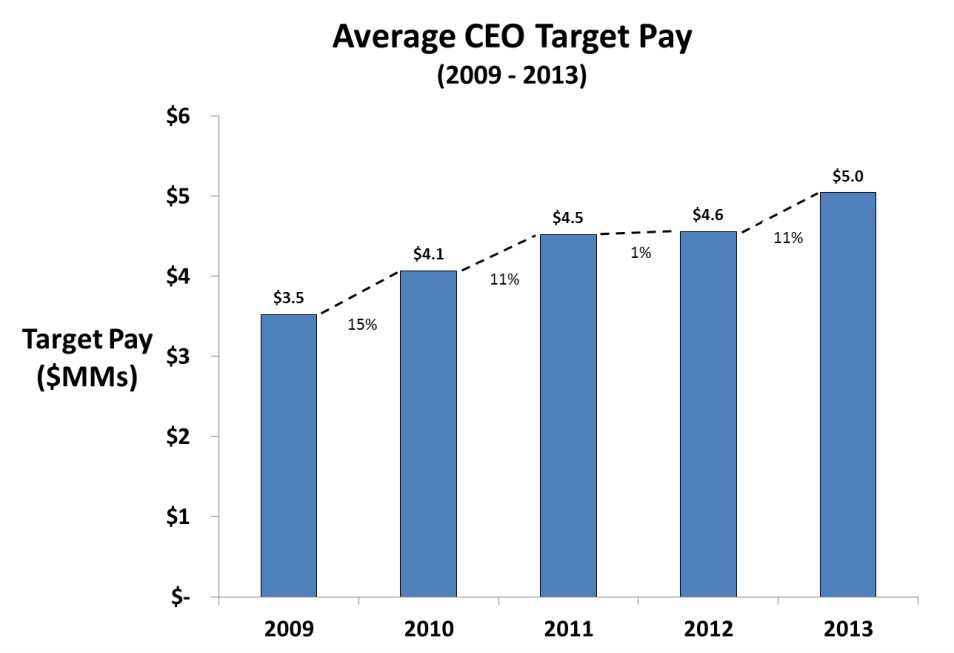
Analysis of our Firm’s Performance Alignment Database, which contains 20 years of executive pay data for the Russell 3000, shows that CEO pay continues to increase year after year. Average CEO target pay has risen from $3.5 million in 2009 to $5 million in 2013, a compounded annual growth rate of 9%. While target pay was nearly constant between 2011 and 2012, it increased by 11% in 2013.

These increases are driven, at least in part, by larger companies (the Russell 3000 companies grew by an average of 5.6% per year between 2009 and 2013), indicating larger CEO job scopes and, in response, higher pay.
One anomaly was in 2012, when CEO target pay was relatively flat. Compensation Committees made decisions after the lackluster Total Shareholder Return (TSR) of 2011 (median -1%), to hold target pay at the previous year’s level. With 2013’s TSR median performance of 32%, well above historical norms, Farient would expect compensation committees to set target pay for fiscal year 2014 above 2013 levels.
Trend #2: Increasing Performance-Adjusted Compensation
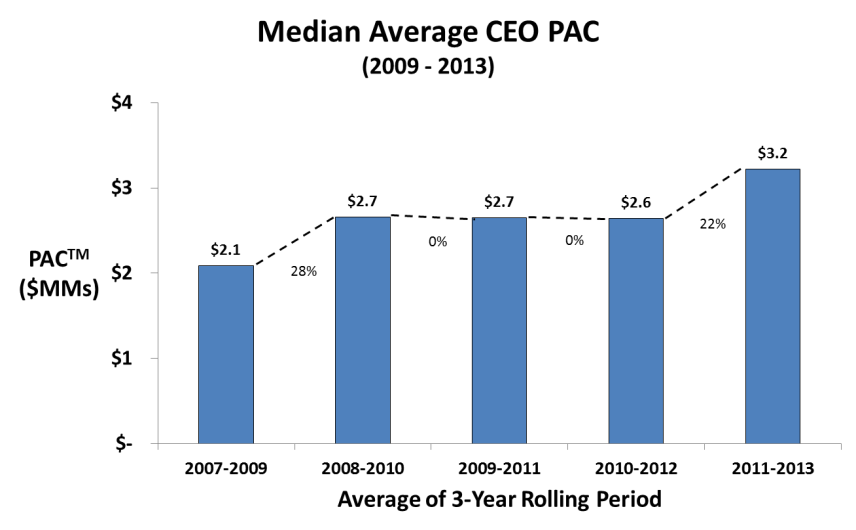
Performance-Adjusted Compensation (PACTM) calculates pay after performance has been taken into account. In other words, performance is recognized in the short-term incentive payouts by using actual incentives and bonuses and in the long-term incentive payouts by using equity values that reflect stock price appreciation and/or decline over three-year rolling performance measurement periods. This differs from other definitions of pay, such as the Summary Compensation Table (SCT), that mix the grant date value of equity with the actual values of other performance-contingent awards. Similar to target CEO pay, the median three-year average CEO PAC also has increased, specifically by 12% compounded annually from $2.1 million in 2009 to $3.2 million in 2013.

The increase in the median of three-year rolling averages of CEO PAC has been driven not only by increases in target pay, but also by climbing stock prices and dividend payouts, i.e., TSR. During 2009 to 2013, the compound annual TSR was 18%. More recently, annual median returns were 15% in fiscal year 2012, and 32% in fiscal year 2013. These returns gave Compensation Committees the confidence to set higher target CEO compensation and also drove up PAC through an increase in the value of equity.
Trend #3: Higher mix of performance-based pay, in particular, performance shares
With problematic pay practices like tax gross-ups, evergreen employment agreements and change in control excesses all but disappearing, proxy advisors and investors are focused on pay-for-performance alignment. In general, for the past several years, executive compensation design has been moving toward long-term incentives (LTIs) in an attempt to align management interests with those of long-term shareholders; further, those LTIs are now largely performance based.
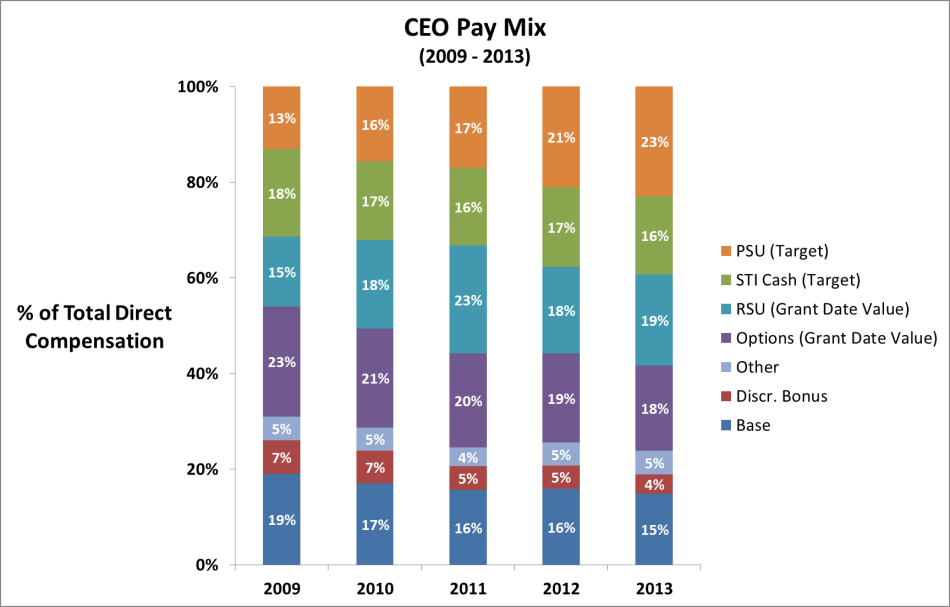
What is interesting is that the move toward performance-based LTI compensation has been in addition to – not a replacement for – other types of pay, and it is primarily responsible for the increase in CEO target pay. As shown in the chart below, the average grant date value of performance-based stock units (PSUs) has gone up by 26% per year over the past five years, comprising an increasingly large portion of overall CEO target pay. This increase is driven by the fact that PSUs have been added to the pay mix as well as the fact that the value of PSUs has gone up once they are in the pay mix.
|
Growth in Target CEO Pay (2009 – 2013) |
|
|
Annual Growth Rate |
|
| Base |
3% |
| Discr. Bonus |
-5% |
| Other |
10% |
| Options (Grant Date Value) |
3% |
| RSU (Grant Date Value) |
17% |
| STI Cash (Target) |
6% |
| PSU (Target) |
26% |
| Total |
9% |
In contrast, increases in salary and options have been relatively modest, while discretionary bonuses, heavily scrutinized by investors, have declined. Surprisingly, with the move toward pay for performance, compensation committees also have increased the size of restricted stock grants (RSUs), a retention device, over that same period. This is perhaps driven by the fact that compensation committees are, by and large, satisfied with CEO performance and want to retain their CEOs with grants of RSUs.

As performance-based compensation comprises a greater portion of CEO pay, sophisticated investors will begin to turn their attention toward the metrics and goals that are being used to determine payouts. We expect that measures and goals will undergo greater scrutiny by investors for their link to TSR in the coming years.
Trend #4: Widening gap between CEO and Named Executive Officer pay
Many stakeholders consider executive pay to be a window into an organization’s corporate governance. To that end, investors continue to evaluate the disparity between CEO and Named Executive Officer (NEO) pay. Significant pay gaps may indicate a weak executive team, power imbalance and/or succession issues, all of which may impact value creation. Several ratings and governance agencies consider CEO pay in relation to an average NEO pay of three times to be the extreme threshold for pay disparity in the executive ranks. Companies that exceed this limit often are called out for the disparity.
Like other measures of CEO pay, the median CEO pay/NEO pay ratio, using values from the Summary Compensation Table (SCT), has increased over the past five years as well, from 2.35 in 2009 to 2.62 in 2013. This increasing gap is fueled by average CEO SCT pay increases of over 11% annually and NEO pay increases of 8%. With this widening gap, more companies are exceeding the three times threshold watched by governance experts, i.e., 30% in 2009 to 37% in 2013.
|
CEO / NEO Pay Ratio |
|
|
2009 |
2.35 |
|
2010 |
2.45 |
|
2011 |
2.46 |
|
2012 |
2.52 |
|
2013 |
2.62 |
With the SEC closing in on its CEO/median worker pay ratio rules, we predict that investors will also pay more attention to internal pay equity at the top of the house.
Trend #5: Shareholder engagement becoming mainstream
In the history of SEC legislation, nothing has given shareholders a stronger voice on executive compensation than SOP. According to a recent study from the Investor Responsibility Research Center Institute and Institutional Shareholder Services Inc., shareholder engagement is up more than 50% over the past four years, with 80% of all Russell 3000 companies engaging with investors. The largest public pension and mutual funds are supplementing proxy advisor recommendations with other inputs like our Performance Alignment Reports, which assess whether there are systemic issues with pay and performance alignment. They are also organizing themselves through associations like the Council of Institutional Investors (CII) to target certain companies and communicate directly with portfolio companies.
Conclusion: A look forward
In aggregate, SOP voting support has remained fairly static since the inception of mandatory SOP in 2011. However, SOP results have changed company by company, depending upon the circumstances. While SOP has all but stopped many of the problematic pay practices (like gross-ups and generous severance deals), CEO target pay and PAC continue to climb. This is largely attributable to the addition of performance shares and the value of those shares in the CEO pay mix. Looking forward, we predict the following developments in executive pay:
- As long as performance (TSR, in particular) continues to climb, CEO compensation, on both a target and performance-adjusted basis, will continue to climb, and aggregate SOP votes will remain stable
- However, investors will put increasing pressure on companies to justify these increases by proving the impact of performance measures and goals on shareholder outcomes
- Because investors believe that the majority of CEO pay programs are aligned with performance, they will expect CEO target and performance-adjusted pay quantum to decline if there is any degradation of performance
- If pay decreases do not accompany performance degradation, SOP support is likely to wane, perhaps dramatically
We encourage Compensation Committees to have robust discussions now – during the “good times” – about whether their pay programs are in fact aligned with performance and whether their programs are geared to produce (and prepared to deliver) relatively low pay in the event of a challenging performance environment.
This article originally appeared on Forbes.com.
© 2025 Farient Advisors LLC. | Privacy Policy | Site by: Treacle Media