
What Glass Lewis Overhaul of PFP Model Portends | Farient Briefings in FULL
September 12, 2025

What Glass Lewis Overhaul of PFP Model Portends

Farient Analysis: Glass Lewis Revamps Its P4P Model
An overhaul of Glass Lewis’s (GL’s) quantitative Pay for Performance (P4P) model will alter how the proxy advisor determines its Say on Pay (SOP) voting recommendations for annual shareholder meetings beginning in 2026. Whether the new methodology results in significantly different SOP outcomes remains to be seen. Farient’s analysis led to questions and recommendations for boards—the focus of this article—but first, a recap of key changes.
Key Changes
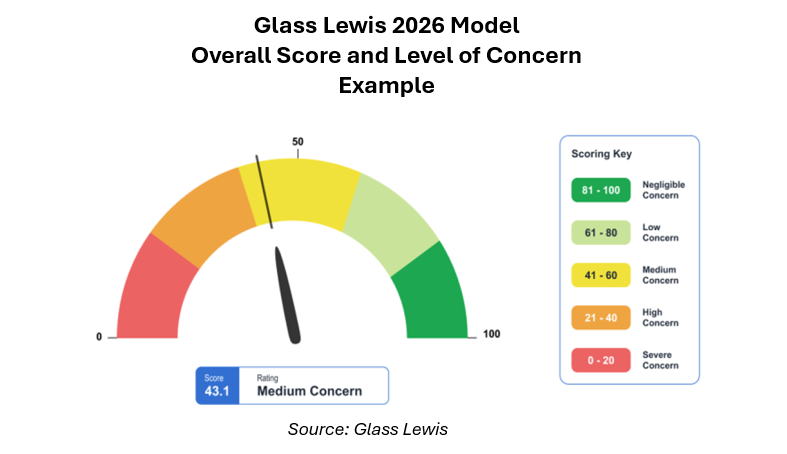
Scoring System: One of the most significant updates is the change from an A to F letter grade system to a 0 to 100 numerical score. With the new system, a lower score indicates greater concern, and the final concern level will range from Negligible Concern (Score of 81-100) to Severe Concern (Score 0-20).
A “Severe” concern will not mean an automatic “against” SOP recommendation. As before, GL will conduct a qualitative review and assess any mitigating factors to determine its final recommendation. How the individual test results will be combined to produce the overall score remains unknown.
Time Horizon: Tests will be based on a five-year assessment period rather than the current three-year period, and with a minimum time horizon of three years.
Tests: Instead of a single test comparing CEO and NEO granted pay with TSR and financial performance, the new assessment comprises five quantitative tests and a qualitative scorecard.
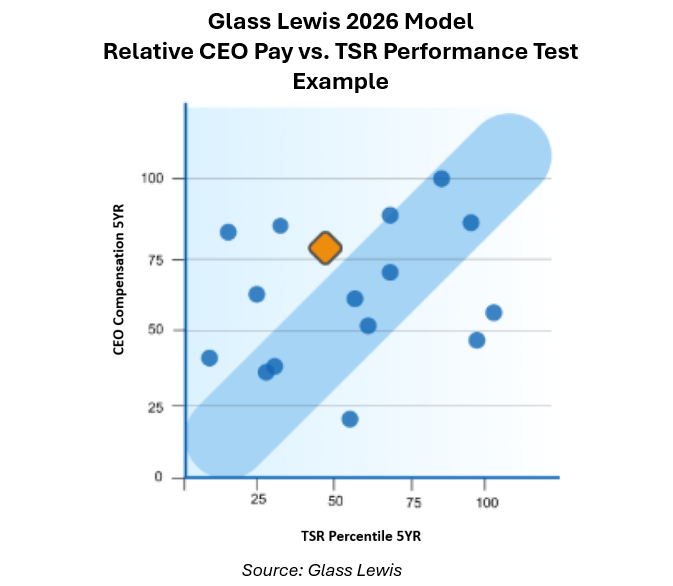
- Test 1: Relative CEO Granted Pay vs. TSR compares the relative rank of CEO granted pay vs. the company’s relative TSR rank as compared to GL’s defined peers over a five-year period. This test is a carryover from the current model and is similar to ISS’s relative degree of alignment test, except that it measures pay and performance over five years, not three
- Test 2: Relative CEO Granted Pay vs. Financial Performance compares the relative rank of CEO granted pay vs. the company’s relative financial performance rank as compared to GL’s peers over a five-year period
All companies will be assessed on revenue growth, ROA, and ROE. Depending upon the company’s sector, other measures could include:
– Banks/Financials/Mortgage REITs: EPS growth and Tangible Book Value Per Share (TPVPS) growth
– Most Equity and Specialized REITs: Funds From Operations (FFO) growth and Operating Cash Flow growth
– All Other Sectors: EPS growth and Operating Cash Flow growth
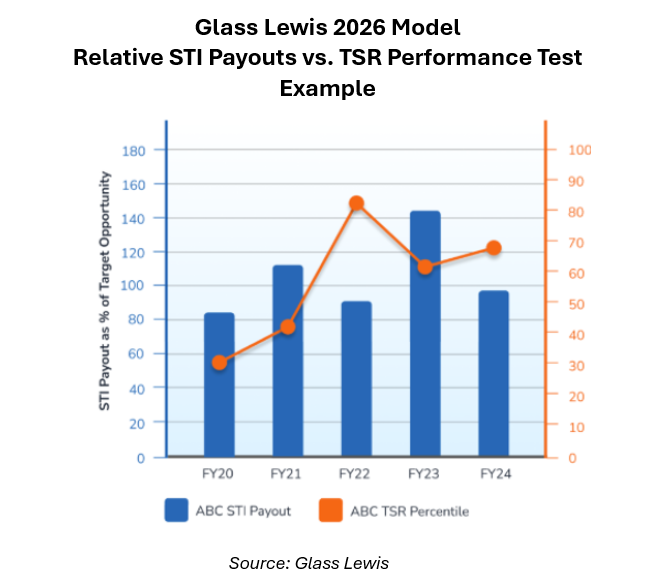
- Test 3: Relative CEO STI Payouts vs. TSR compares the rank of STI payouts as a percent of target to the company’s relative TSR rank vs. broad market benchmarks over each of the last five years. GL will apply a penalty when the STI payout is above the market median and the TSR is below the median
- Test 4: Relative NEO granted Pay vs. Financial Performance compares the relative rank of NEO granted pay vs. the company’s relative financial performance rank as compared to GL’s peers over a five-year period. This is similar to Test 2, but it uses NEO pay (excluding the CEO)
- Test 5: CAP-to-TSR Ratio (U.S.) calculates a ratio of five-year aggregate CEO Compensation Actually Paid (CAP), as disclosed, vs. five-year TSR and compares that ratio to GL’s peers based on market capitalization. A poorer score is generated if the CAP-to-TSR ratio is well above the peer median ratio (i.e., ≥150% of the peer median)
Qualitative Scorecard (U.S. and Canada):
- The qualitative scorecard will impact GL’s overall assessment based on answers to each of the following questions:
- Were any one-off awards granted?
- Was upward discretion [on incentive payouts] exercised?
- Is fixed pay greater than variable pay?
- Are incentives unlimited, or are limits not disclosed?
- Is the maximum LTI payout excessive? (unclear what is considered “excessive”)
- Is there a short vesting period for LTIs?
- Are any performance goals not disclosed?
Peer Group: GL will continue to use its proprietary model to build custom peer groups for the tests. However, two tests will use different benchmarks – the STI Payouts vs. TSR test (Test 3) will use broad market benchmarks, and the CAP-to-TSR Ratio test (Test 5) will use a benchmark of peers based on market capitalization.
Market Coverage: As part of this model update, GL is expanding its P4P assessment to the U.K., Europe, and Australia, in addition to its current coverage in the U.S. and Canada.
[Note: Please refer to the article from Southlea, our GECN Group partner in Canada, for more details on the implications for Canadian companies. Link: https://www.southlea.com/glass-lewis-announces-new-pay-for-performance-methodology/]
Unanswered Questions
Will the model changes matter? While this is a significant overhaul of the P4P model by GL, and we know the outputs will look different from before, it remains to be seen whether this means a fundamental change in GL’s “For” and “Against” SOP recommendations. GL may have simply created a model that quantifies its historical approach to SOP reviews. Moreover, we do not know to what extent GL will use its new P4P model to guide its SOP recommendation, or if it will rely more on its qualitative review.
Why is GL continuing to use a granted pay definition? Using a granted pay definition to assess pay and performance alignment is an inherently flawed approach. The granted value of pay generally reflects target, not realized (i.e., performance-adjusted) pay, and therefore is generally insensitive to performance. P4P alignment is effectively determined by using realized or realizable definitions of pay. However, GL is incorporating measures of STI payouts and CAP vs. performance, which is a step in the right direction.
How, specifically, does the model work? GL has yet to release a detailed methodology for its new model, so specific parameters remain unknown. For example:
- How will the tests be combined into an overall score?
- How will individual years be weighted?
- How will financial performance measures be weighted?
- Will there be defined thresholds for concern on each test?
- What will happen when CAP is negative?
- How will companies with no STI targets be handled?
How will a five-year time horizon impact GL’s assessment? GL’s new five-year time horizon has not previously been used by either GL or ISS for relative P4P tests. Under a longer time period, pay and performance comparisons can become unwieldy, especially if companies change leadership, restructure, or peer groups. While institutional shareholders will likely welcome this longer-term perspective, it could introduce significant noise in the data, making it more difficult to draw conclusions.
Is GL attempting to gain relevance vs. ISS on P4P and SOP? GL is likely aware that its SOP recommendations, at least in the U.S., generally have less of an impact on SOP results than the recommendations of its chief rival, ISS (see Farient’s What Happens When Proxy Advisors Say No To Executive Compensation?). With ISS having made only minor changes to its P4P model over recent years, GL may see an opportunity to get ahead of ISS by updating its model, incorporating new data (e.g., CAP data from PvP), and taking a longer-term perspective (i.e., five years instead of three).
Is GL using the changes to grow its corporate arm? Issuers subscribe to GL’s web services that include simulating the P4P model results. By making changes to the model and arguably making it more complex, companies and their advisors have an incentive to subscribe to GL’s corporate services.
Farient’s Analysis: Recommendations
Farient suggests that companies take steps to assess the potential impact of GL’s new P4P model, including:
- Determine which of your investors rely on GL to inform their voting decisions and the percentage of shares that will be affected. Understanding this will help determine how much time to devote to GL’s model updates
- Review the model changes to determine if there are areas of concern for your company. While methodologies are not yet fully known, questions companies can begin to tackle include:
- How do CEO and NEO pay over one-year and five-year periods compare with those of GL peers for your company?
- Where does the company rank on TSR and financial performance vs. GL peers over these time periods?
- How do STI payouts as a percent of target compare to one-year TSR and the broader market?
- What is the ratio of CAP to TSR? How does that compare to the market?
- Will the company be flagged for any of GL’s qualitative scorecard measures?
- Simulate the GL results once methodology specifics are released
- Prepare for more robust disclosures if you anticipate needing to address P4P alignment concerns. For example, your company may need to explain the impact of changes in executive leadership (CEO changes in particular) or the impact of company recapitalizations or restructurings
- Develop shareholder and proxy advisor engagement strategy. Depending on the situation, engage with shareholders and proxy advisors to understand their views, explain your company’s compensation program, and tell your company’s P4P alignment story
In the News
CHROs Stay Put Longer as They Increasingly Become Strategic Assets—Agenda
CEOs are increasingly treating CHROs as strategic partners—bringing them to the table on succession planning, talent pipeline development, and long-horizon business issues, the article reports. With this expanded role, CHROs are not only staying longer but also becoming indispensable to the success and resilience of the enterprise.
“We are entering an era where there will be a lot of focus on human capital and talent, and that raises the prominence and the relative position of the CHRO versus their other brethren,” said R.J. Bannister, partner and COO at Farient Advisors. Bannister added that the impact of AI on the workplace is one of the top issues shaping the CHRO agenda today.
Read more
Thinking About Trimming PSUs from Your CEO’s Pay? Not So Fast—Agenda
Performance share units (PSUs) are under renewed scrutiny, with critics questioning whether boards set goals that are too easy to achieve. Still, new research suggests most investors aren’t ready to abandon them. A survey of more than 100 large investors found that 71% favor continuing to use PSUs, and 86% want them to comprise at least half of long-term incentive awards.
In Agenda, Farient Advisors Partner Marc Hodak highlights that while concerns about pay-for-performance misalignment are valid, boards face significant challenges if they consider moving away from PSUs. “Our research shows that, on average, companies using PSUs have underperformed and paid more than those that don’t,” Hodak said. “Yet, investors still overwhelmingly support them, provided companies are transparent about how goals are set.”
Read moreWhere to Find Us
NACD Leading Minds of Governance & Technology
Ask-the-Expert Panel on Compensation and Governance
Farient Partner and COO R.J. Bannister joins an Ask-the-Expert panel with EY’s Robyn Bew and others to share their outlooks on digital oversight, board governance, and aligning compensation strategies with talent. This session is part of NACD’s daylong program that also includes lunch and a Q&A with Boston Consulting Group Global Chair Rich Lesser on the board-CEO dynamic.
The Westin at Boston’s Seaport
September 17, 2025
8:00 a.m.-3:00 p.m.
The 350 Club
London Breakfast
Farient Partner Stephen Cahill will lead an overview of the 2025 AGM season at London’s 350 Club, the esteemed community for FTSE 350 board members and FTSE 100 senior leaders.
At the offices of Egon Zehnder
Nova South
160 Victoria Street
London SW1
September 17, 2025
8:30 a.m.-10:00 a.m.
Directors & Boards
The Intersection of Compensation and Talent (Virtual)
Perspectives on talent strategy, leadership succession, and trends shaping executive compensation are the focus of a webinar with Robin A. Ferracone, founder and CEO of Farient Advisors, and Lakecia Gunter, who serves on the board of IDEX Corp., hosted by Directors & Boards Editor Bill Hayes and Publishing Director David Shaw. This webinar is a must for forward-thinking directors seeking to stay ahead on compensation practices.
September 25, 2025
2 p.m.
Strengthening C-Suite Succession Planning
How can boards best prepare to mitigate leadership risks and secure mission-critical talent? Proactive strategies will be presented by Farient Principal Tracy Wittman, KPMG Senior Advisor Annalisa Barrett, and public company board director Colleen B. Brown during this Summit session on October 14, 2025, at 10:45 a.m.
National Harbor, Maryland
October 12-15, 2025
Understanding Climate Incentives
Exclusive: Around the globe, the heat is on to combat climate change while some political regimes denounce the veracity between greenhouse gas emissions and a warming planet. Nevertheless, large corporations are reporting Scope 1, Scope 2, and, increasingly, Scope 3 greenhouse gas emissions and linking reductions to executive compensation, according to Farient Advisors’ newly published 2025 Global Trends in Stakeholder Incentives: Climate Strategies and Incentives for Corporate Sustainability.
Learn more about how the world’s largest companies are setting and achieving climate goals by linking climate measures to executive incentives by sector and geography.
About Farient Advisors
Farient Advisors LLC is an independent premier executive compensation, performance, and corporate governance consultancy. Farient provides a full array of services, linking business strategy to compensation through a tailored, analytically rigorous, and collaborative approach. Farient has locations in Los Angeles, New York, and London and works with clients globally through its partnership in the Global Governance and Executive Compensation (GECN) Group. Farient is a certified diverse company and is recognized by the Women’s Business Enterprise National Council.
![]()
© 2026 Farient Advisors LLC. | Privacy Policy | Site by: Treacle Media